Analyzing your iTunes library
17 Jul 2017Once I realized how easy it is to import data from your iTunes library into R, I couldn’t help taking the opportunity to procrastinate (it’s not like I have a dissertation to write or anything). Here’s how to do it:
- Open iTunes and export your library from the drop down menu: File -> Library -> Export Library
- Run the following script, substituting the path to your iTunes library:
# load packages
library("XML")
library("plyr")

# import
lib <- readKeyValueDB("~/Desktop/Library.xml")
songs <- ldply(lapply(lib$Tracks, data.frame, stringsAsFactors=FALSE))
Next you may want to clean up the data a bit. I decided to trim some of the columns and delete or combine some of the genres (but you will want to customize this for your own library):
# decide which genre and columns to keep
keep.genre <- c("Soundtrack","Rock","Alternative","Holiday","Pop","Metal","Dance","Country","Electronic","Industrial","Singer/Songwriter","Hip-Hop/Rap","Hip Hop/Rap","Classical","Classical Crossover","World","Easy Listening","Folk","R&B/Soul","Reggae","Traditional Folk","Punk Rock","Oldies","Christian & Gospel","K-Pop","Pop/Rock","Bluegrass","Indie","Jazz","Vocal","Children's Music","Adult Alternative")
keep.cols <- c("Name","Artist","Album","Genre","Total.Time","Date.Added","Play.Count")
songs <- songs[songs$Genre %in% keep.genre, keep.cols]

# combine similar genre
songs[songs$Genre=="Hip Hop/Rap","Genre"] <- "Hip-Hop/Rap"
songs[songs$Genre=="Adult Alternative","Genre"] <- "Alternative"
songs[songs$Genre=="Traditional Folk","Genre"] <- "Folk"
songs[songs$Genre=="Classical Crossover","Genre"] <- "Classical"
songs[songs$Genre=="Christian & Gospel","Genre"] <- "Holiday"
To generate visualizations of my iTunes library, I used the packages wordcloud and ggplot2:
# load packages
library("wordcloud")
library("ggplot2")
Here is how to make a wordcloud displaying the genres that are most represented in my library. More common genre are displayed with larger text and placed in middle of the cloud (the latter feature can be eliminated by setting the option random.order=TRUE):
# create table of song genres
genre <- table(songs$Genre)

# plot wordcloud
wordcloud(names(genre), genre, random.order=FALSE, colors=rainbow(5))
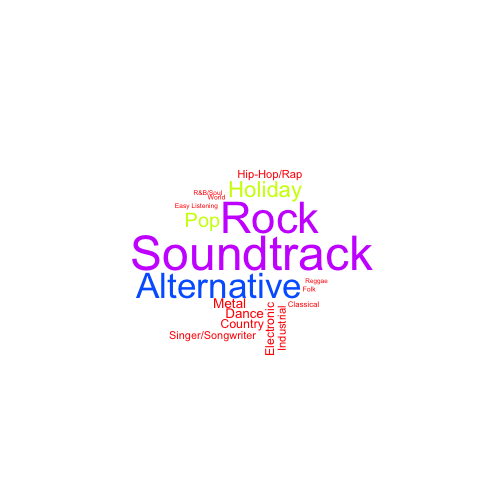
Soundtracks are heavily represented because I tend to purchase complete soundtracks for movies I like. However, I rarely listen to these albums start-to-finish more than a once or twice. Instead, I choose a few songs I really like and incorporate them into playlists. Thus, simply listing the genres of all of the songs in my library gives a misleading picture of my favorite genres. A better representation of my musical taste can be found by weighting each genre by the playcounts of the songs in that genre:
# replace NAs with 0 in song play counts
songs$Play.Count <- ifelse(is.na(songs$Play.Count), 0, songs$Play.Count)

# weight genre by playcount
genre.w <- table(rep(songs$Genre, times=songs$Play.Count))

# plot wordcloud
wordcloud(names(genre.w), genre.w, random.order=FALSE, colors=rainbow(5))
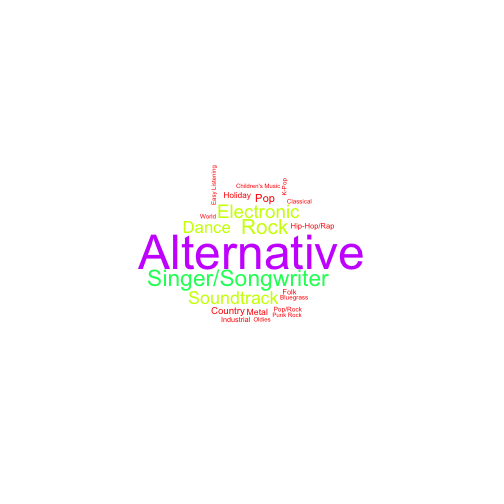
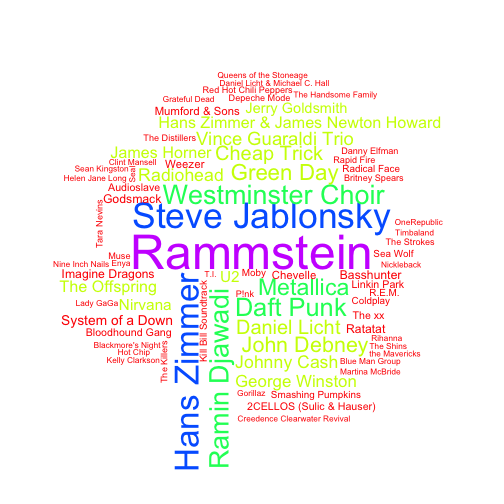
This is more or less what I expect to see. A lot of the music I listen to on a regular basis falls into the amorphous ‘alternative’ genre. In fact, ‘alternative’ music is such a wastebasket genre that doesn’t reveal a whole lot about my musical tastes. To get a more nuanced picture, let’s make a wordcloud for my favorite artists, first unweighted:
# artist wordcloud, unweighted
artist <- table(songs$Artist)
wordcloud(names(artist), artist, random.order=FALSE, colors=rainbow(5))
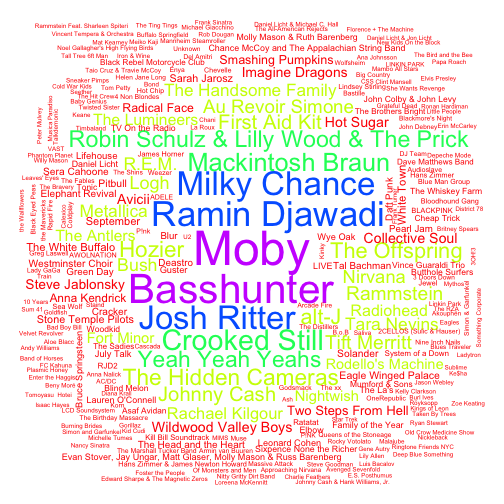
And now weighted by play count:
# artist wordcloud, weighted by play count
artist.w <- table(rep(songs$Artist, times=songs$Play.Count))
wordcloud(names(artist.w), artist.w, random.order=FALSE, colors=rainbow(5))
Unsurprisingly, the weighted and unweighted wordclouds look quite different. The unweighted wordcloud reflects the fact that I own every Rammstein album in existence, because this was the music that defined my angry adolescence. Occasionally, Rammstein still hits the spot, but I don’t listen to them often as an adult. Hans Zimmer, Steven Jablonsky, and Ramin Djawadi are all soundtrack composers- Hans Zimmer composed a number of blockbuster movie soundtracks (e.g., The Dark Knight and Interstellar), while the latter two are best known for the Transformers movies and Game of Thrones, respectively. The Westminster Choir is there because I apparently have a ton of Christmas music by them for reasons I can’t really explain, because I hate it (I think I copied these from my dad’s collection many years ago without knowing what it was).
The weighted wordcloud highlights Ramin Djawadi again, as well as several artists that were not prominent in the unweighted wordcloud (e.g., Josh Ritter, Moby, Basshunter, and Milky Chance). The implication is that although I don’t have a lot of songs from these artists, I have one or a few of their songs that I listen to a lot. Let’s zoom in even more and look at my most played songs. Since song names can be long, they don’t lend themselves to wordclouds as well as genres or artists, so I’ll visualize this with a barplot of my top 20 most played songs:
# table of top 20 most played songs
song.tab <- songs[sort.int(songs$Play.Count, index.return=T, decreasing=T)$ix,][1:20,c("Play.Count","Name","Artist","Genre")]
song.tab$Name <- factor(song.tab$Name, levels=rev(song.tab$Name))

# barplot showing top 20 most played songs
ggplot(song.tab) +
  geom_bar(aes(x=Name, y=Play.Count), stat="identity") +
  geom_text(aes(x=20:1, y=9, label=Artist), color="white", size=2.5, hjust=0, fontface=4) +
  xlab("Song name") +
  ylab("Play count") +
  coord_flip()
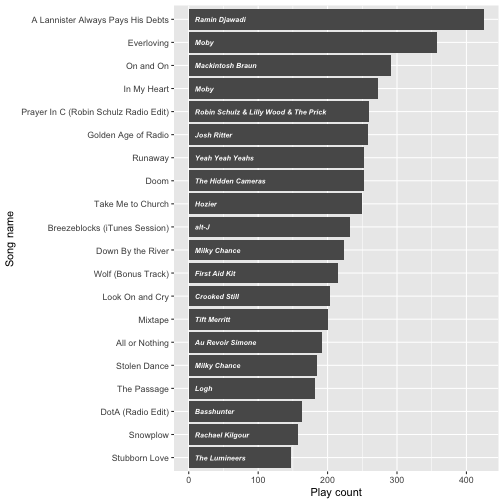
Yupp… I have definitely gone through phases of listening to many of these songs on a loop, and many of them are also permanent fixtures on otherwise variable playlists.
I explored the idea of performing sentiment analysis on song lyrics to capture the emotional valence of my musical preferences, but unfortunately the step of extracting lyrics from an iTunes library turned out to be harder than I thought. There are a number of applications that allow you to easily add lyrics to your library (e.g., I used lyrical without a problem), but the iTunes library export feature currently does not include lyrics in the metadata, so I would have to write a script that extracts that information from each *.m4a file, which seems like more work than its worth. Oh well- I’ve gotten enough procrastination out of my iTunes library for the time being!
