Olympic history: Over a century of growth
31 May 2018The data used in this post can be downloaded from figshare and the R code is on GitHub.
Introduction
This is my first post analyzing data on the history of the modern Olympics, which I scraped from www.sports-reference.com. I’ll keep this one short and sweet. My goal is simply to provide a broad-strokes overview of trends in Olympic participation, focusing on growth in the number of athletes, nations, and events. I will delve into more nuanced topics in future posts, for which this post will serve as a backdrop.
Data exploration: Trends in participation
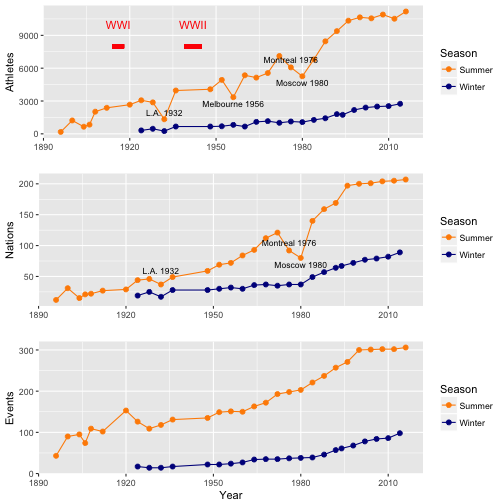
From Athens 1986 to Rio 2016, the Olympics has ballooned from 176 athletes from 12 nations participating in 43 events to 11,179 athletes from 207 nations participating in 306 events. The following three plots chart the number of participating athletes, nations, and events (excluding the non-athletic Art Competitions) in every Olympic Games in history.

You can see two long periods without any Games between 1912-1920 and 1936-1948, corresponding to WWI and WWII. In addition, a few Games are highlighted where dips occur in one or more of the plots:
-
L.A., 1932: Attendance dipped because these Games occured in the midst of the Great Depression and in a remote location, such that many athletes were unable to afford the trip to the Olympics.
-
Melbourne, 1956: Attendance dipped due to several boycotts: Iraq, Egypt, and Lebanon did not participate due to the involvement of France and Britain in the Suez Crisis; the Netherlands, Spain, Switzerland, and Cambodia did not participate due to the Soviet Union’s beat down of the Hungarian Revolution; and China did not participate in protest of the IOC’s recognition of Taiwan.
-
Montreal, 1976: Attendance dipped because 25 nations, mostly African, boycotted the Games in reponse to apartheid policies in South Africa. Attendance at the 1980 Winter Olympics in Lake Placid wasn’t affected much since African nations have a limited presence at the Winter Games.
-
Moscow, 1980: Attendance dipped because 66 nations, including the U.S., boycotted the Games in response to the Soviet invasion of Afghanistan.
The growth trends start to level off roughly around the year 2000, at least for the Summer Games. The list of events and athletes cannot grow indefinitely: the Olympics can only hold people’s attention for so long, and hosting more athletes and more events costs money. The Summer Olympics may have reached a saturation point near the turn of the century, with around 300 events and 10,000 athletes. The Winter Olympics would seem to have more growing room, but ice and snow sports are not practical or popular in most nations, and that doesn’t seem likely to change soon.
In my next post, I’ll zoom in on a largely forgotten aspect of the Olympics from the first half of the 20th century: the Art Competitions.
